Photo by: Rômulo Queiroz via Pexels
Quick Summary / TL;DR
Yes, you can make money with prop firms, but the empirical reality is defined by a steep statistical filter. Multi-firm datasets show that while 10% to 14% of traders pass initial evaluation challenges, only approximately 7% of all account purchasers ever extract a cash payout. Profitable traders treat prop firms as asymmetric risk vehicles—limiting risk to 0.5%–1.0% per trade, utilizing EOD drawdown models, and keeping trade frequency under four setups daily to avoid mechanical rule traps.
The retail proprietary trading industry has expanded into an $850 million global ecosystem, generating intense marketing promises of institutional capital access for modest entry fees. That expansion leads every serious retail trader to a foundational question: can you actually make money with prop firms, or does the business model rely entirely on forfeited challenge fees? The short answer is that sustainable payouts are achievable, but they require navigating a mathematical bottleneck where 93% of market participants fail to secure a withdrawal.
Prop firms provide leveraged buying power without exposing your personal savings to catastrophic balance deficit liability. However, passing an evaluation and withdrawing consistent profit splits are two distinct disciplines. To determine whether prop trading fits your strategy, you must understand the verified pass rates, drawdown calculations, multi-attempt cost economics, and behavioral patterns separating the top 7% of payout recipients from the losing majority.
Table of Contents
- The Statistical Reality: Can You Make Money With Prop Firms?
- Evaluation Challenge Pass Rates: Where Traders Get Filtered
- The Funded Payout Bottleneck: Passing vs Withdrawing Profits
- Why Traders Fail: Mechanical Drawdown Traps vs Market Analysis
- Forex CFD Counterparty Risk vs Centralized Futures Models
- The Math of Multi-Attempt Costs: How Eval Fees Compound
- How the Top 7% of Profitable Traders Actually Make Money
- Frequently Asked Questions
- Editorial Takeaways for Sustainable Prop Profitability
The Statistical Reality: Can You Make Money With Prop Firms?
To evaluate whether you can make money with prop firms, you must first examine the aggregate capital flows of the modern proprietary trading market. According to the Track360 Prop Trading Market Analysis Report, the retail prop sector generated over $850 million in global annual revenue, with more than 2.1 million funded traders purchasing over 12 million challenge accounts worldwide. Substantial capital flows through these platforms, but its distribution is highly concentrated.

The business model of a retail prop firm operates on structural probability. Entry fees from evaluation attempts fund platform overhead, data infrastructure, and the profit splits delivered to successful participants. When examining multi-firm infrastructure data compiled by software provider FPFX Tech across 300,000 active accounts and 100,000 unique traders, the average successful payout amounted to roughly 4% of nominal account size. For a $50,000 funded account, that represents a $2,000 cash withdrawal—delivering an average 400% return on the initial evaluation fee.
The payouts are tangible. According to verified industry tracking published in the Tradeify Futures Prop Statistics Report, global payouts from regulated futures prop firms exceeded $325 million in 2025 alone. However, capturing a share of that capital requires understanding that prop trading is an operational risk game rather than a standard brokerage account.
Evaluation Challenge Pass Rates: Where Traders Get Filtered
The first barrier between a trader and a funded payout is the evaluation challenge. Most firms require traders to reach a profit target (typically 6% to 10%) while adhering to rigid daily loss limits and maximum drawdown thresholds. Empirical data shows that this phase filters out the vast majority of applicants.

Across major retail firms, documented pass rates show consistent patterns across one-phase and two-phase structures, as tracked in the Trader’s Second Brain Pass Rate Analysis:
| Prop Firm Model | Evaluation Format | Estimated Pass Rate | Primary Filter Mechanism |
|---|---|---|---|
| FTMO | 2-Phase (Challenge + Verification) | 10% – 12% | Combined Phase 1 & Phase 2 drawdown rules |
| Topstep | 1-Phase (Trading Combine) | 15% – 20% | Daily loss limit & consistency targets |
| Apex Trader Funding | 1-Phase (Evaluation) | 12% – 18% | Intraday trailing high-water mark drawdown |
| FundedNext | 2-Phase / Stellar 1-Step | 12% – 15% | Time decay & daily loss restrictions |
| Industry Baseline | Multi-firm aggregate | 5% – 14% | Position oversizing in week one |
Single-phase challenges register slightly higher raw pass rates than two-phase programs because they remove the second verification stage. However, as detailed in our guide on how to pass prop firm challenge step by step, single-phase evaluations often compensate by tightening trailing drawdown parameters or imposing strict consistency metrics before granting withdrawals.
The Funded Payout Bottleneck: Passing vs Withdrawing Profits
Securing a funded account certificate is a milestone, but it is not where a trader makes money. The crucial drop-off in the retail prop ecosystem occurs between passing the evaluation and requesting the first payout.

According to QuantVPS industry trend tracking, only 7% of all traders who purchase an evaluation account ever receive a cash payout. While 14% of evaluation attempts successfully pass, FPFX Tech tracking reveals that approximately 45% of funded traders go on to collect at least one withdrawal. The remaining 55% of funded accounts breach risk parameters within their first 30 to 90 days of funded trading.
This drop-off occurs because the psychological context shifts once an account is funded. In an evaluation, a blown account represents a sunk fee that can be reset with another purchase. In a funded account, drawdown limits are absolute, and fear of losing earned profits often triggers erratic risk sizing. A prop firm is only as good as its third payout; while many operators easily clear an initial $500 payout for promotional goodwill, sustaining five-figure withdrawals over consecutive quarters requires adherence to strict institutional sizing.
Why Traders Fail: Mechanical Drawdown Traps vs Market Analysis
The prevailing assumption among beginner traders is that evaluation failures stem from poor chart reading or low win-rate setups. Trader tracking data tells a completely different story: roughly 70% of all evaluation failures result directly from loss limit breaches rather than inadequate strategy edge.
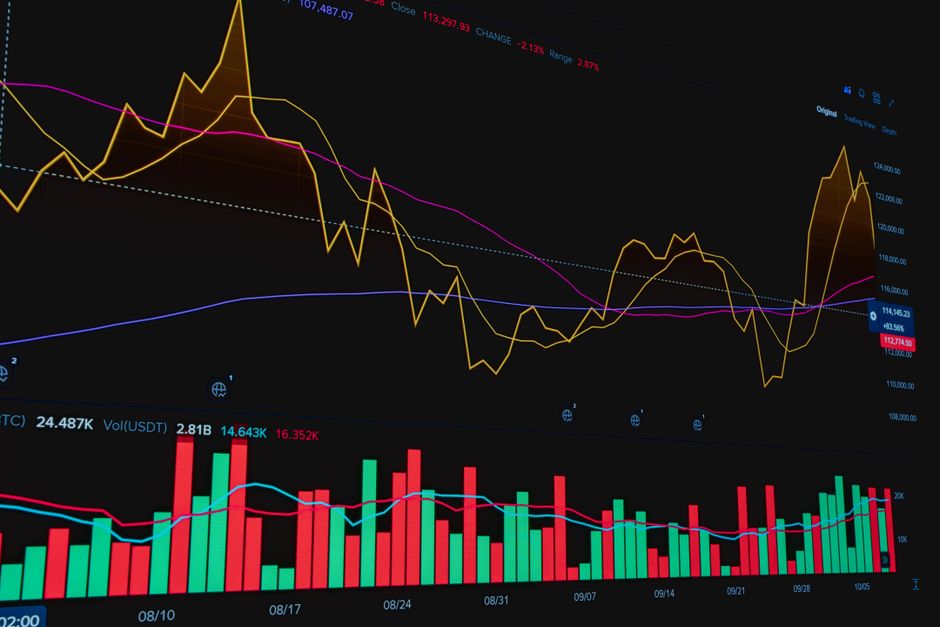
Trader’s Second Brain execution metrics categorize the primary drivers of account termination:
- Maximum Total Loss Limit (50% of failures): Cumulative account drawdown exceeding the firm’s total loss buffer, typically caused by oversized position sizing during a standard losing streak.
- Daily Loss Limit (20% of failures): Single-day drawdown breaches resulting from revenge trading after an early morning loss.
- Time Decay / Expiration (15% of failures): Rushing trades to beat arbitrary evaluation calendar deadlines (now largely removed by top-tier firms).
- Rule & News Violations (8% of failures): Trading through high-impact macro releases (CPI, FOMC, NFP) on accounts with strict execution restrictions.
- Trader Abandonment (5% of failures): Traders giving up on accounts after minor early drawdowns.
A critical structural mechanism is the difference between trailing intraday drawdown and static or End-of-Day (EOD) drawdown. Trailing drawdown calculated from open equity peaks locks in paper gains against the trader. If an NQ position reaches +$1,500 before pulling back to close at +$200, an intraday trailing calculation drags your liquidation threshold upward by $1,300, permanently compressing your safety buffer. (High-water mark trailing drawdown treats your unrealized peak as contract equity while treating intraday market noise as account insolvency.) Firms that calculate drawdown at the daily market close provide significantly higher survival probability.
Forex CFD Counterparty Risk vs Centralized Futures Models
Your ability to make money with prop firms is heavily influenced by the asset class and regulatory structure of the firm you select. The industry underwent a massive structural shift following regulatory actions by global authorities.

In August 2023, the U.S. Commodity Futures Trading Commission (CFTC) filed a high-profile enforcement action against My Forex Funds, freezing over $310 million in assets while alleging synthetic slippage and counterparty conflicts. Although a federal court subsequently dismissed the CFTC action in May 2025 after finding bad-faith conduct in evidence presentation—ordering the agency to pay $3.1 million in defense sanctions—the multi-year litigation accelerated a widespread transition away from offshore CFD models.
Traders have increasingly migrated toward centralized futures prop firms. Unlike decentralized CFD brokers that generate synthetic pricing feeds, futures prop firms route transactions through licensed US brokerages directly to centralized exchanges like the Chicago Mercantile Exchange (CME). Every participant sees identical order book depth, fixed tick valuations, and verifiable volume, removing counterparty execution disputes. As examined in our review of Apex Trader Funding payout proof and our ranking of the top 5 best prop firms, transparent payout processing is far more reliable on regulated exchange infrastructure.
The Math of Multi-Attempt Costs: How Eval Fees Compound
A hidden trap in retail prop trading is cumulative fee compounding. Many participants view a $150 challenge as cheap capital access. However, because the median trader requires three evaluation attempts before passing, total entry expenses frequently eat a major portion of the eventual first payout.

Evaluating the cumulative math reveals the true capital required to reach funded status across different fee models:
| Prop Firm & Nominal Size | Base Cost Per Attempt | Median Attempts to Pass | Cumulative Cost Before Payout | Break-Even Profit Target Needed |
|---|---|---|---|---|
| FTMO ($100K) | $540 (one-time) | 3 attempts | $1,620 | $2,025 at 80% split |
| Topstep ($50K) | $49 / month | 2–3 active months | $98 – $147 | $163 at 90% split |
| Apex ($50K Full) | $160 (or $35–$40 promo) | 2 attempts + PA fee | $210 – $300 | $300 at 100% first tier |
| FundedNext ($50K) | $229 (one-time) | 2–3 attempts | $458 – $687 | $763 at 90% split |
If you spend $1,620 across multiple attempts on a 100K evaluation, your first $2,000 profit split merely returns your trading balance to net-zero cash flow. Treating evaluation fees as structured business R&D expenses and maintaining a strict budget cap per quarter is mandatory to avoid negative cumulative expectancy.
How the Top 7% of Profitable Traders Actually Make Money
Traders who consistently make money with prop firms do not rely on high-frequency scalp algorithms or high-leverage gambles. They treat prop challenges as asymmetric risk vehicles, structuring their trade execution around the firm’s specific mathematical constraints.

A futures trader in the r/FuturesTrading community documented passing three consecutive $50K accounts after repeatedly failing five earlier evaluations. His adjustment was mechanical rather than technical: he reduced his position size from 3 E-mini NQ contracts to 2 Micro MNQ contracts, capped his daily loss limit at 50% of the firm’s allowance ($500 instead of $1,000), and spread his profit target over 14 trading days rather than trying to clear it in two sessions. The result was zero drawdown breaches and three consistent monthly payouts.
Comparative tracking data between losing accounts and profitable payout recipients highlights clear behavioral distinctions:
| Execution Metric | Failing Traders (93% of Cohort) | Profitable Payout Traders (Top 7%) |
|---|---|---|
| Risk Per Trade | 2.0% – 5.0% of total account buffer | 0.5% – 1.0% of account buffer |
| Daily Trade Frequency | 6.8 trades per day (high turnover) | 3.2 trades per day (selective execution) |
| Daily Loss Management | Trades into maximum daily loss limit | Stops trading at 50% of allowable daily loss |
| Pacing & Timeline | Attempts to pass in 1–3 trading sessions | Compounds gains across 12–20 trading sessions |
| Account Architecture | Single oversized account attempt | Multiple smaller accounts mirrored via trade copiers |
By utilizing trade copiers across multiple $50K accounts rather than trading a single high-stress $150K account, successful traders diversify platform counterparty exposure while extracting substantial cumulative payouts on low individual contract sizing.
Frequently Asked Questions

Editorial Takeaways for Sustainable Prop Profitability
Can you make money with prop firms? Yes. The data confirms that hundreds of millions of dollars in profit splits are distributed annually to funded retail traders. However, prop firms are commercial businesses designed around mathematical probability decay, where the entry fees of the losing 93% finance the ecosystem.
To join the profitable 7%, stop treating evaluation challenges like high-stakes lottery tickets. Select firms that utilize End-of-Day or static drawdown models, cut your standard contract sizing by half, cap your personal daily loss at 50% of the firm limit, and allow compounding to hit your profit targets. If you treat the challenge as a leveraged gamble, you are simply subsidizing the firm’s balance sheet. If you treat it as risk-controlled institutional execution, the statistical edge shifts firmly into your favor.
About the Author